3. Analysis
3.1. Stroop effect experiment
Congruent |
Incongruent |
|---|---|
12.079 |
19.278 |
16.791 |
18.741 |
9.564 |
21.214 |
8.630 |
15.687 |
14.669 |
22.803 |
12.238 |
20.878 |
14.692 |
24.572 |
8.987 |
17.394 |
9.401 |
20.762 |
14.480 |
26.282 |
22.328 |
24.524 |
15.298 |
18.644 |
15.073 |
17.510 |
16.929 |
20.330 |
18.200 |
35.255 |
12.130 |
22.158 |
18.495 |
25.139 |
10.639 |
20.429 |
11.344 |
17.425 |
12.369 |
34.288 |
12.944 |
23.894 |
14.233 |
17.960 |
19.710 |
22.058 |
16.004 |
21.157 |
In this experiment the independent variable is the information shown to the people: information with mismatch between the name of a color. The dependant variable is the people reaction time.
3.2. Hypotheses
The null hypothesis refers the situation where there are no statistics difference on reaction time beetween match and missmatch in word and color. The alternative hypothesis refers the opposite: there are statistics difference on reaction time beetween match and missmatch in word and color.
The objective is to compare the reaction time mean in these two situaction. So
Null hypothesis equation \(H_\text{0}: Avg_\text{ congruent} = Avg_\text{ incongruent}\)
Alternative hypothesis equation \(H_\text{1}: Avg_\text{ congruent} \neq Avg_\text{ incongruent}\)
With \(Avg: Average\)
3.3. Statistics
Stat |
Congruent |
Incongruent |
|---|---|---|
count |
24.000000 |
24.000000 |
mean |
14.051125 |
22.015917 |
std |
3.559358 |
4.797057 |
min |
8.630000 |
15.687000 |
25% |
11.895250 |
18.716750 |
50% |
14.356500 |
21.017500 |
75% |
16.200750 |
24.051500 |
max |
22.328000 |
35.255000 |
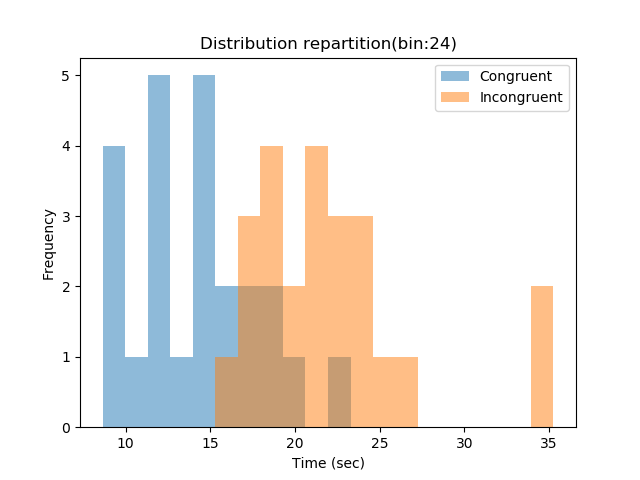
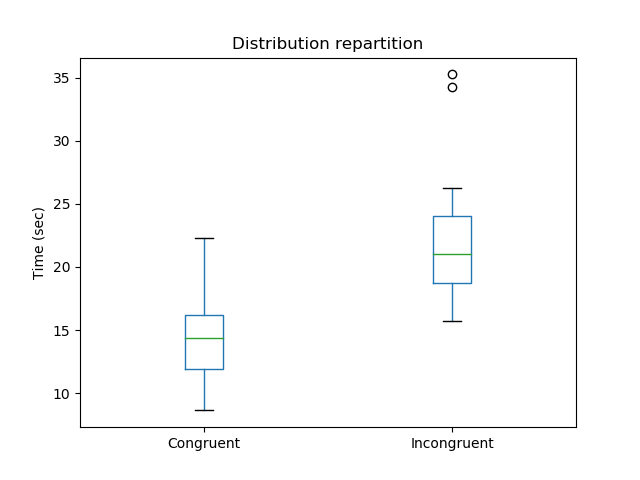
Based on this basic statistics and plots, we show that the reaction time of the incongruent people is longer compared to the congruent.
Another statistic is the p-value based on t-test. There are two sample t-tests:
Independant : The independent samples t-test is used when two separate sets of independent and identically distributed samples are obtained, one from each of the two populations being compared.
Dependant : The dependant samples t-tests typically consist of a sample of matched pairs of similar units, or one group of units that has been tested twice.
This experiment used the same group of people for the congruent and incongruent test. So, we have to compute the dependant t-test. Based on t-test, we determine the p-value. We can consider that the null hypothesis is rejected when p-value is lower than 0.05.
On this experiment we have :
t-statistic: -8.020706944109957
p-value: 4.103000585711178e-08
This analyse show a statistic significant difference on reaction time between congruent and incongruent people.